Separating neural signals
When stimulus and choice agree
In this synthetic task, stimulus A should lead to choice A, and B to B. When almost every choice is correct, can an analysis tell the stimulus and choice signals apart?
Choose the trial mix.
Explore precomputed fits
Error trials per stimulus / 40 trials each
Balanced = 20 errors per stimulus: 20 trials in each of the four cells.
Training trial allocation
Stimulus A → choice A
Correct trials
39
Stimulus A → choice B
Error trials
1
Stimulus B → choice A
Error trials
1
Stimulus B → choice B
Correct trials
39
1 error per stimulus · 80 trials total · design rank 4 of 4
One filled dot = one synthetic training trial. The trial mix is set by the study.
Selected result
A clean label. A noisier estimate.
The component is strongly choice-driven, yet its reconstruction is less accurate than with four equally sampled cells.
Choice attribution
97.63%Attribution to the known choice signal.
Reconstruction error
4.14×
the balanced setting
Lower is closer to the true signal.
Measured against synthetic ground truth. Means across five noise seeds, one population.
97.63% choice attribution; 4.14 times the balanced reconstruction error.
Inspect exact values & all five seeds ↓The useful distinction.
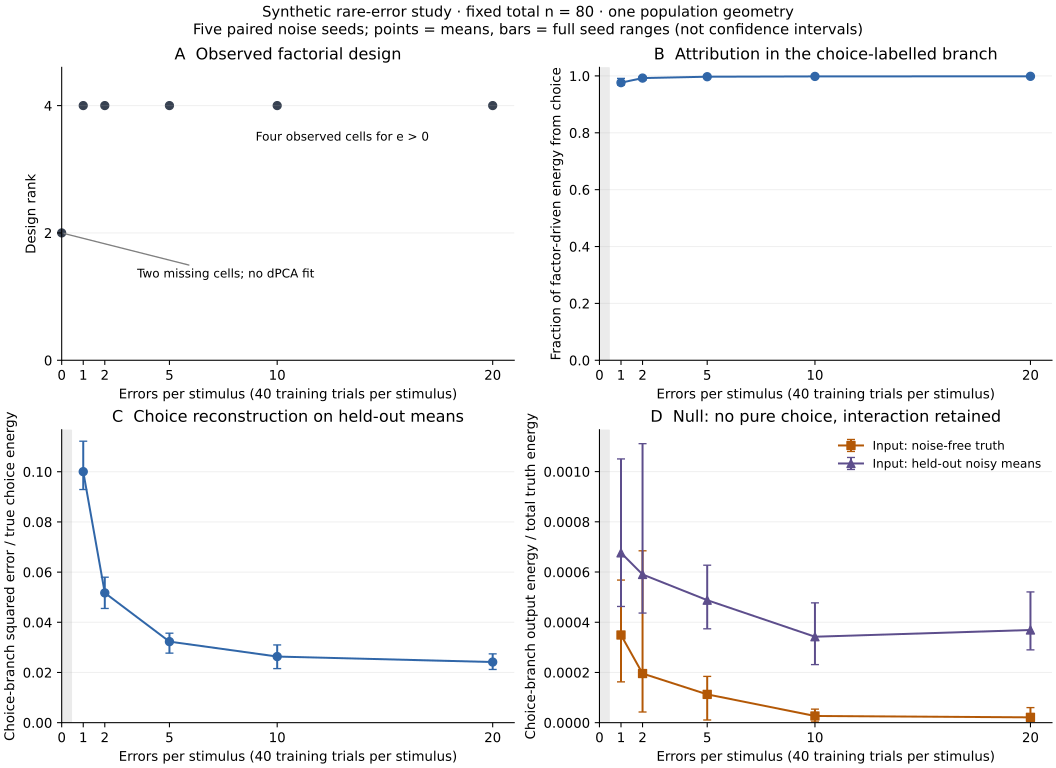
In this synthetic setting, at one error per stimulus, mean choice attribution is already 97.63%. Yet choice reconstruction error is about four times its value in the balanced setting. A clean label does not tell the whole story.
Exact values & all five noise seeds
Choice attribution
Higher = more choice-driven
97.63%
Mean across five noise seeds
Choice reconstruction error
Lower = closer to truth
0.1000
Mean normalized squared error
Each point is one noise seed. The two axes have different scales. Ranges show all five seeds in one fixed synthetic population; they are not confidence intervals.
See the full curves & the control
The control removes the pure choice contribution while retaining the stimulus–choice interaction. It tests what appears in the choice-labelled branch when that main contribution is absent.
Select a trial mix above to inspect the corresponding null result.
What was measured?
Demixed principal component analysis (dPCA) uses task labels to find low-dimensional components associated with time, stimulus, choice and their interaction. Here, the generating factors are known, so attribution and reconstruction can be assessed separately.
Choice attribution is the fraction of factor-driven score energy attributable to the true choice factor in the choice-labelled branch. Choice reconstruction error is that branch’s squared error on independent held-out cell means, divided by the known pure choice signal’s energy. It is not a classification error rate. The headline multiplier divides the selected mean error by the balanced mean error, using the same five noise seeds.
The fixed design uses 24 synthetic neurons, 32 time bins, two stimuli and two choices. Each positive-count fit weights the four observed cell means equally; rare cells still have noisier estimates. Test pools and noise seeds are paired across the six allocations. At zero errors, the design has rank two and dPCA is not fitted.
The separate PCA comparison has the same four-component budget but no predefined choice branch. dPCA receives task labels; PCA does not. This view makes no claim that one method is generally better.
Scope, provenance & downloads
This independent methods study uses synthetic data with known generating factors. The controls display saved results; they do not run a new fit. Biological recordings have not been evaluated.
One population geometry, fixed signal strengths and one regularizer limit the conclusion. These curves do not establish a universal minimum error count or causal choice coding.
Method: Kobak et al. (2016), using the pinned Machens Lab Python implementation.
All 120 result rows ↓Study configuration ↓Provenance & file hashes ↓
The downloads contain the saved results and configuration; the study’s analysis code is not included.